Web services are a means of streaming GIS data to your computer without having to download the data in order to use it. Using web services avoids the need to download data which can be very large and avoids the problem of not knowing if you are using the most recent dataset.
GIS Hub data is made available via ArcGIS Online (the Hub Data Portal is a means for accessing this data) for use by desktop and web applications. These web services are best used when there is:
- Low Internet bandwidth/VPN speed restrictions (e.g., working from home)
- Greatest ease of access and use when using ArcGIS Pro (these services can also be used with ArcMap though not as streamlined)
- Desire to symbolize the data as you wish
- Familiarity with other ArcGIS Online-based data sources
Using ArcGIS Pro
- It is recommended to directly search and access this data via the 'Portal' tab in the Catalog Pane using 'ndgishub' as a prefix of the search
- In the Catalog Pane, click on the 'Portal' tab and then click on the ArcGIS Online icon
- By default, the search will be set to 'Content'; you can also click on the 'Groups' button
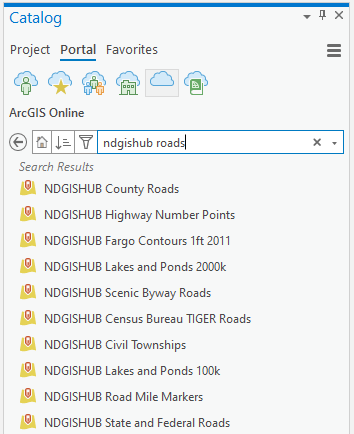
- For 'Content' search by name, type for example: 'ndgishub roads' then press <enter> to see a list of items
- For 'Groups' search by name, type for example: 'ndgishub roads' then press <enter> to see only the 'NDGISHub Transportation' group that contains the roads data
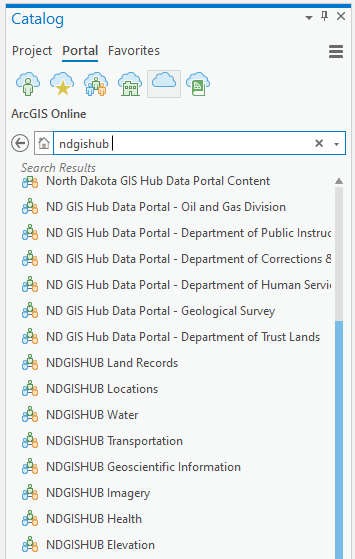
- To list all groups, type only: 'ndgishub'
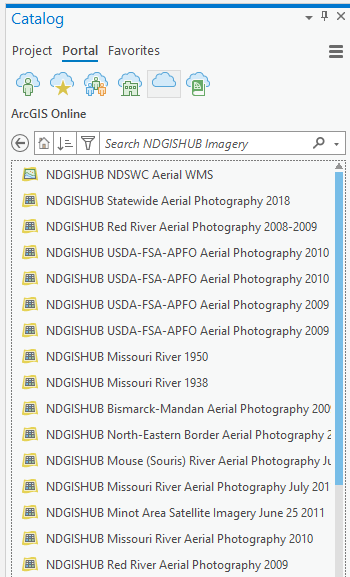
- Then double-click on a group name to see all data items, for example:
More advanced searching is done the same way as done in ArcGIS Online. Here are some examples, type the following:
- title:"missouri" AND owner: "ndgishub"
- title: "ndgishub parcel" and owner: ndgishub
- ndgishub usda 2020
- owner: nddoh OR owner: nd-deq
- Once the data has been added to the map, it can be treated in the same fashion as adding data from a geodatabase
You may find it helpful to select the Filter icon (to the left of the search box) and then select Status - Authoritative
Please note that once vector data have been added to the map, the appearance of that data can be changed, e.g., color, line width, etc., the same way it is done when adding data from a geodatabase.